OBSERVABILITY
See everything your agents do
Distributed tracing, Prometheus metrics, and a full audit trail across all three pillars. Monitor every tool call, sandbox execution, and skill invocation — with automatic secret masking built in.
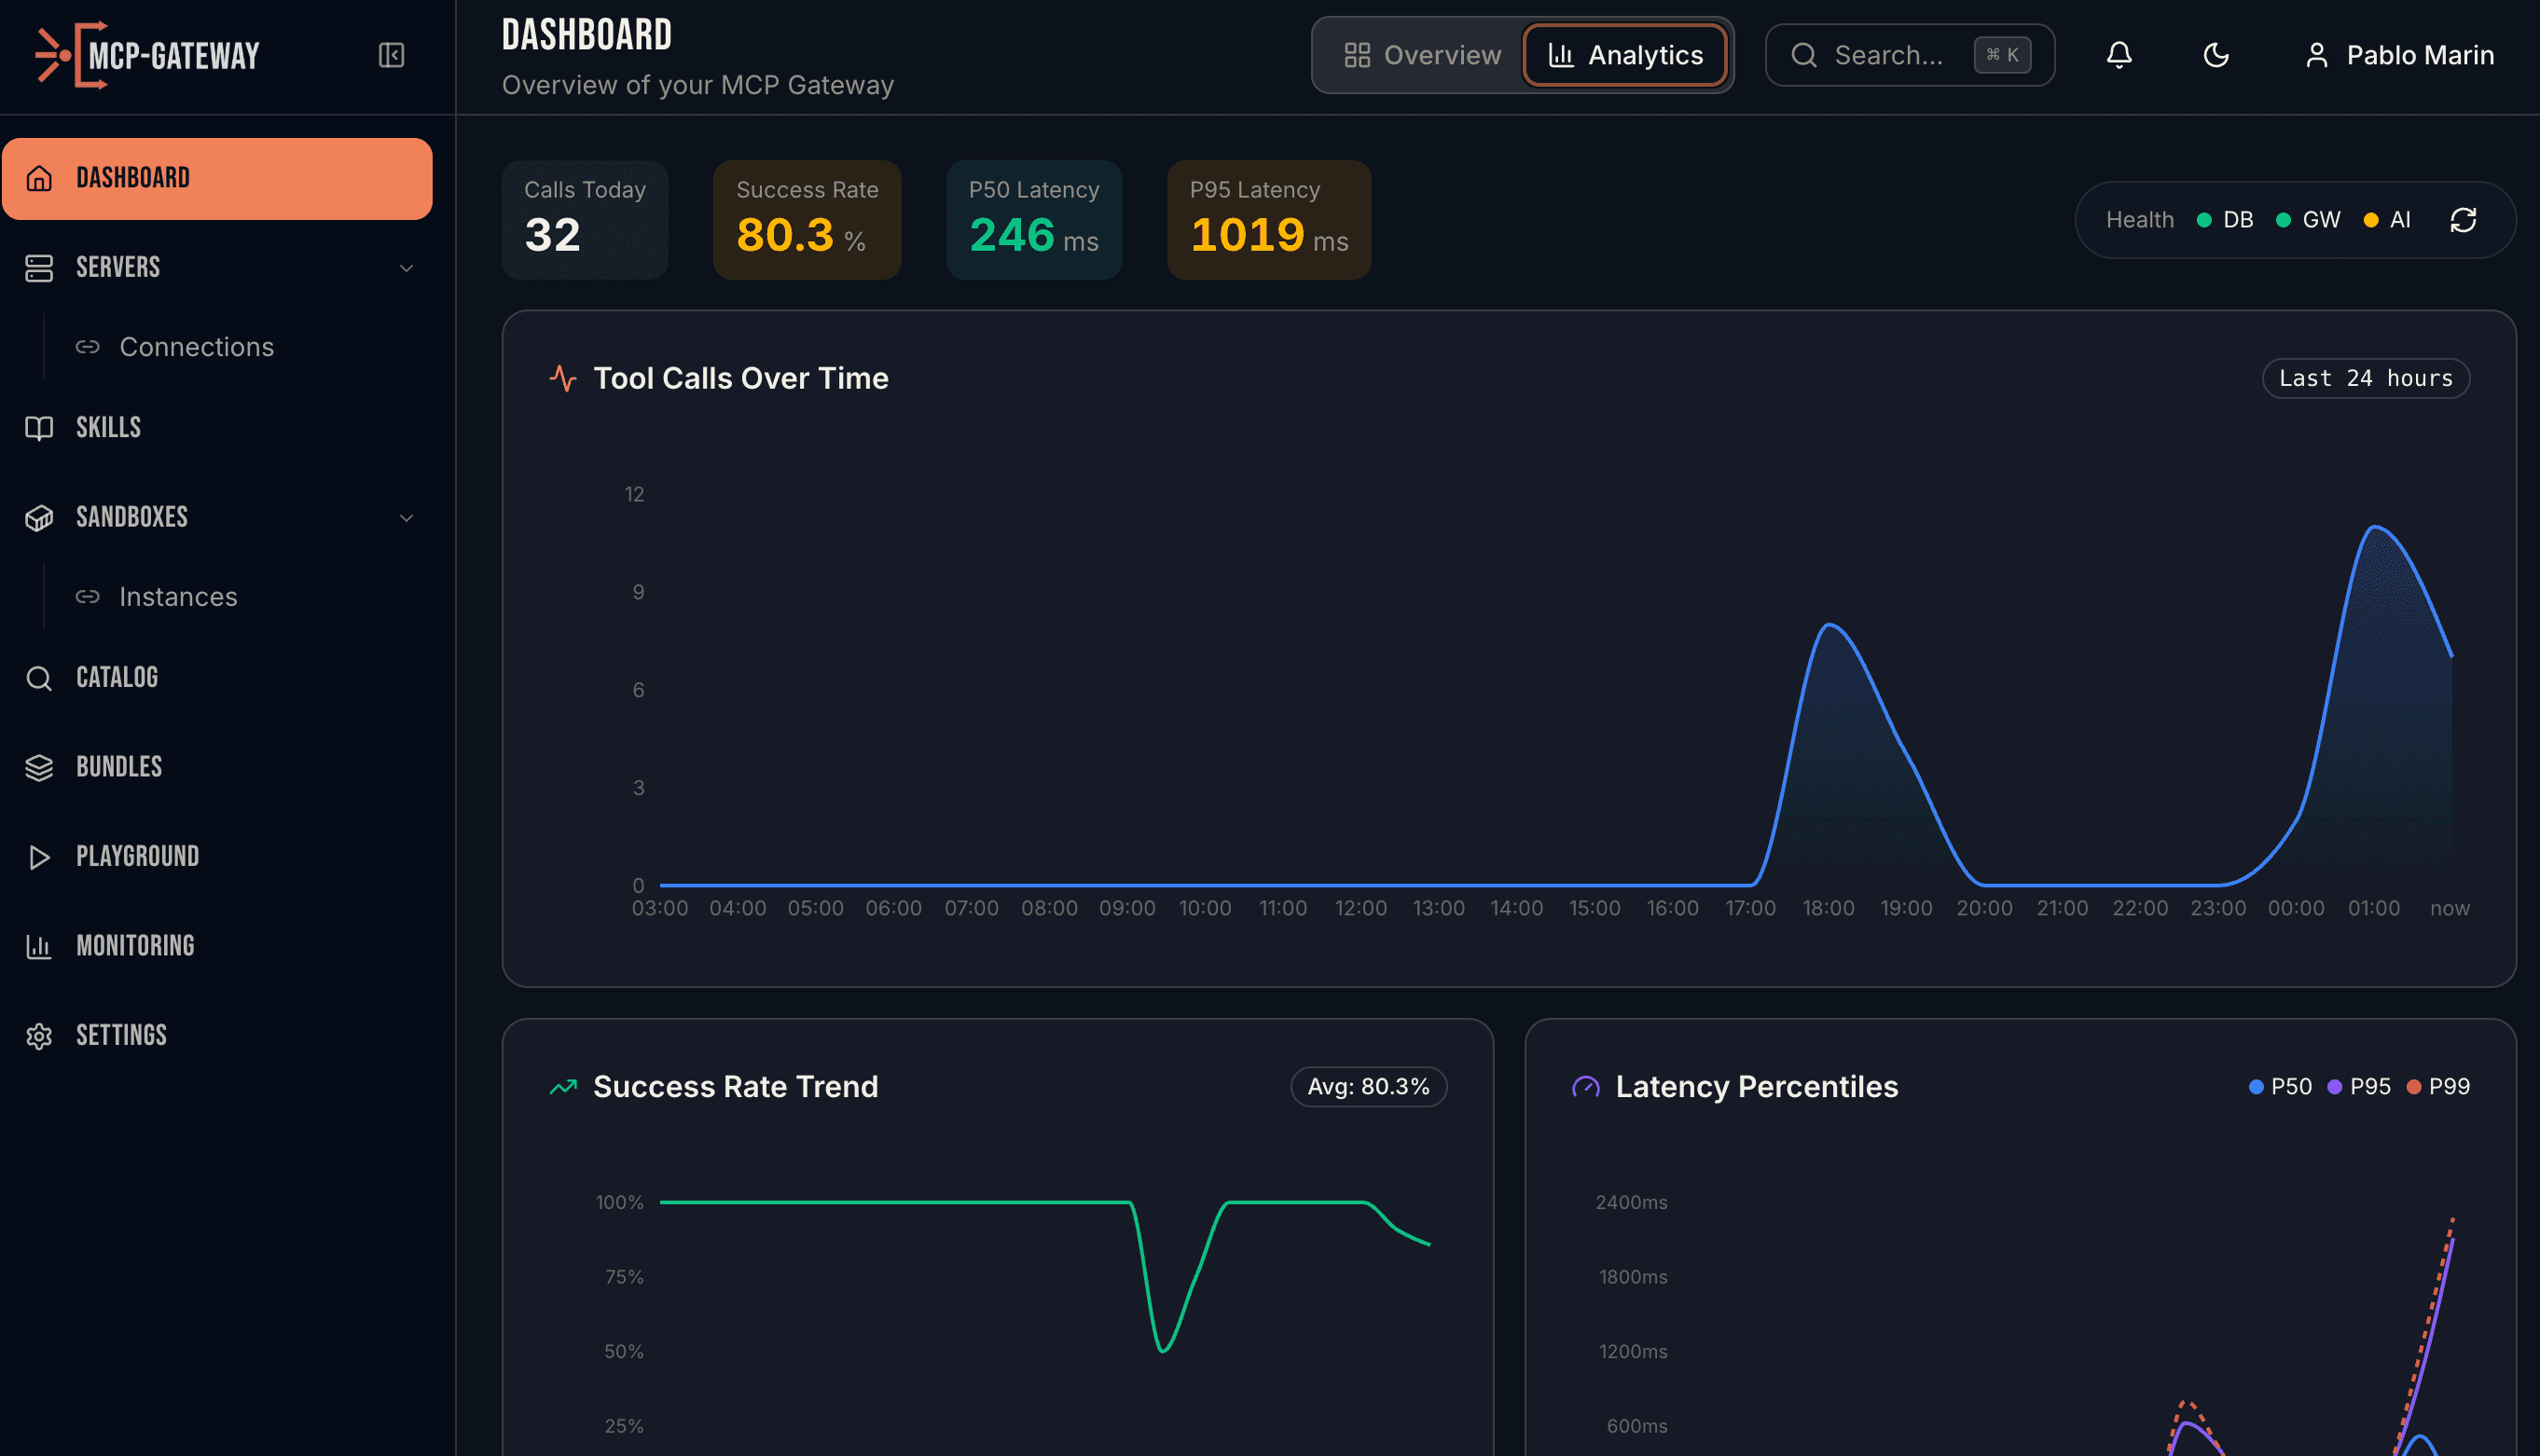
Real-time dashboard with tool call volume, success rates, and latency percentiles
HOW IT WORKS
Full visibility across tools, skills, and sandboxes
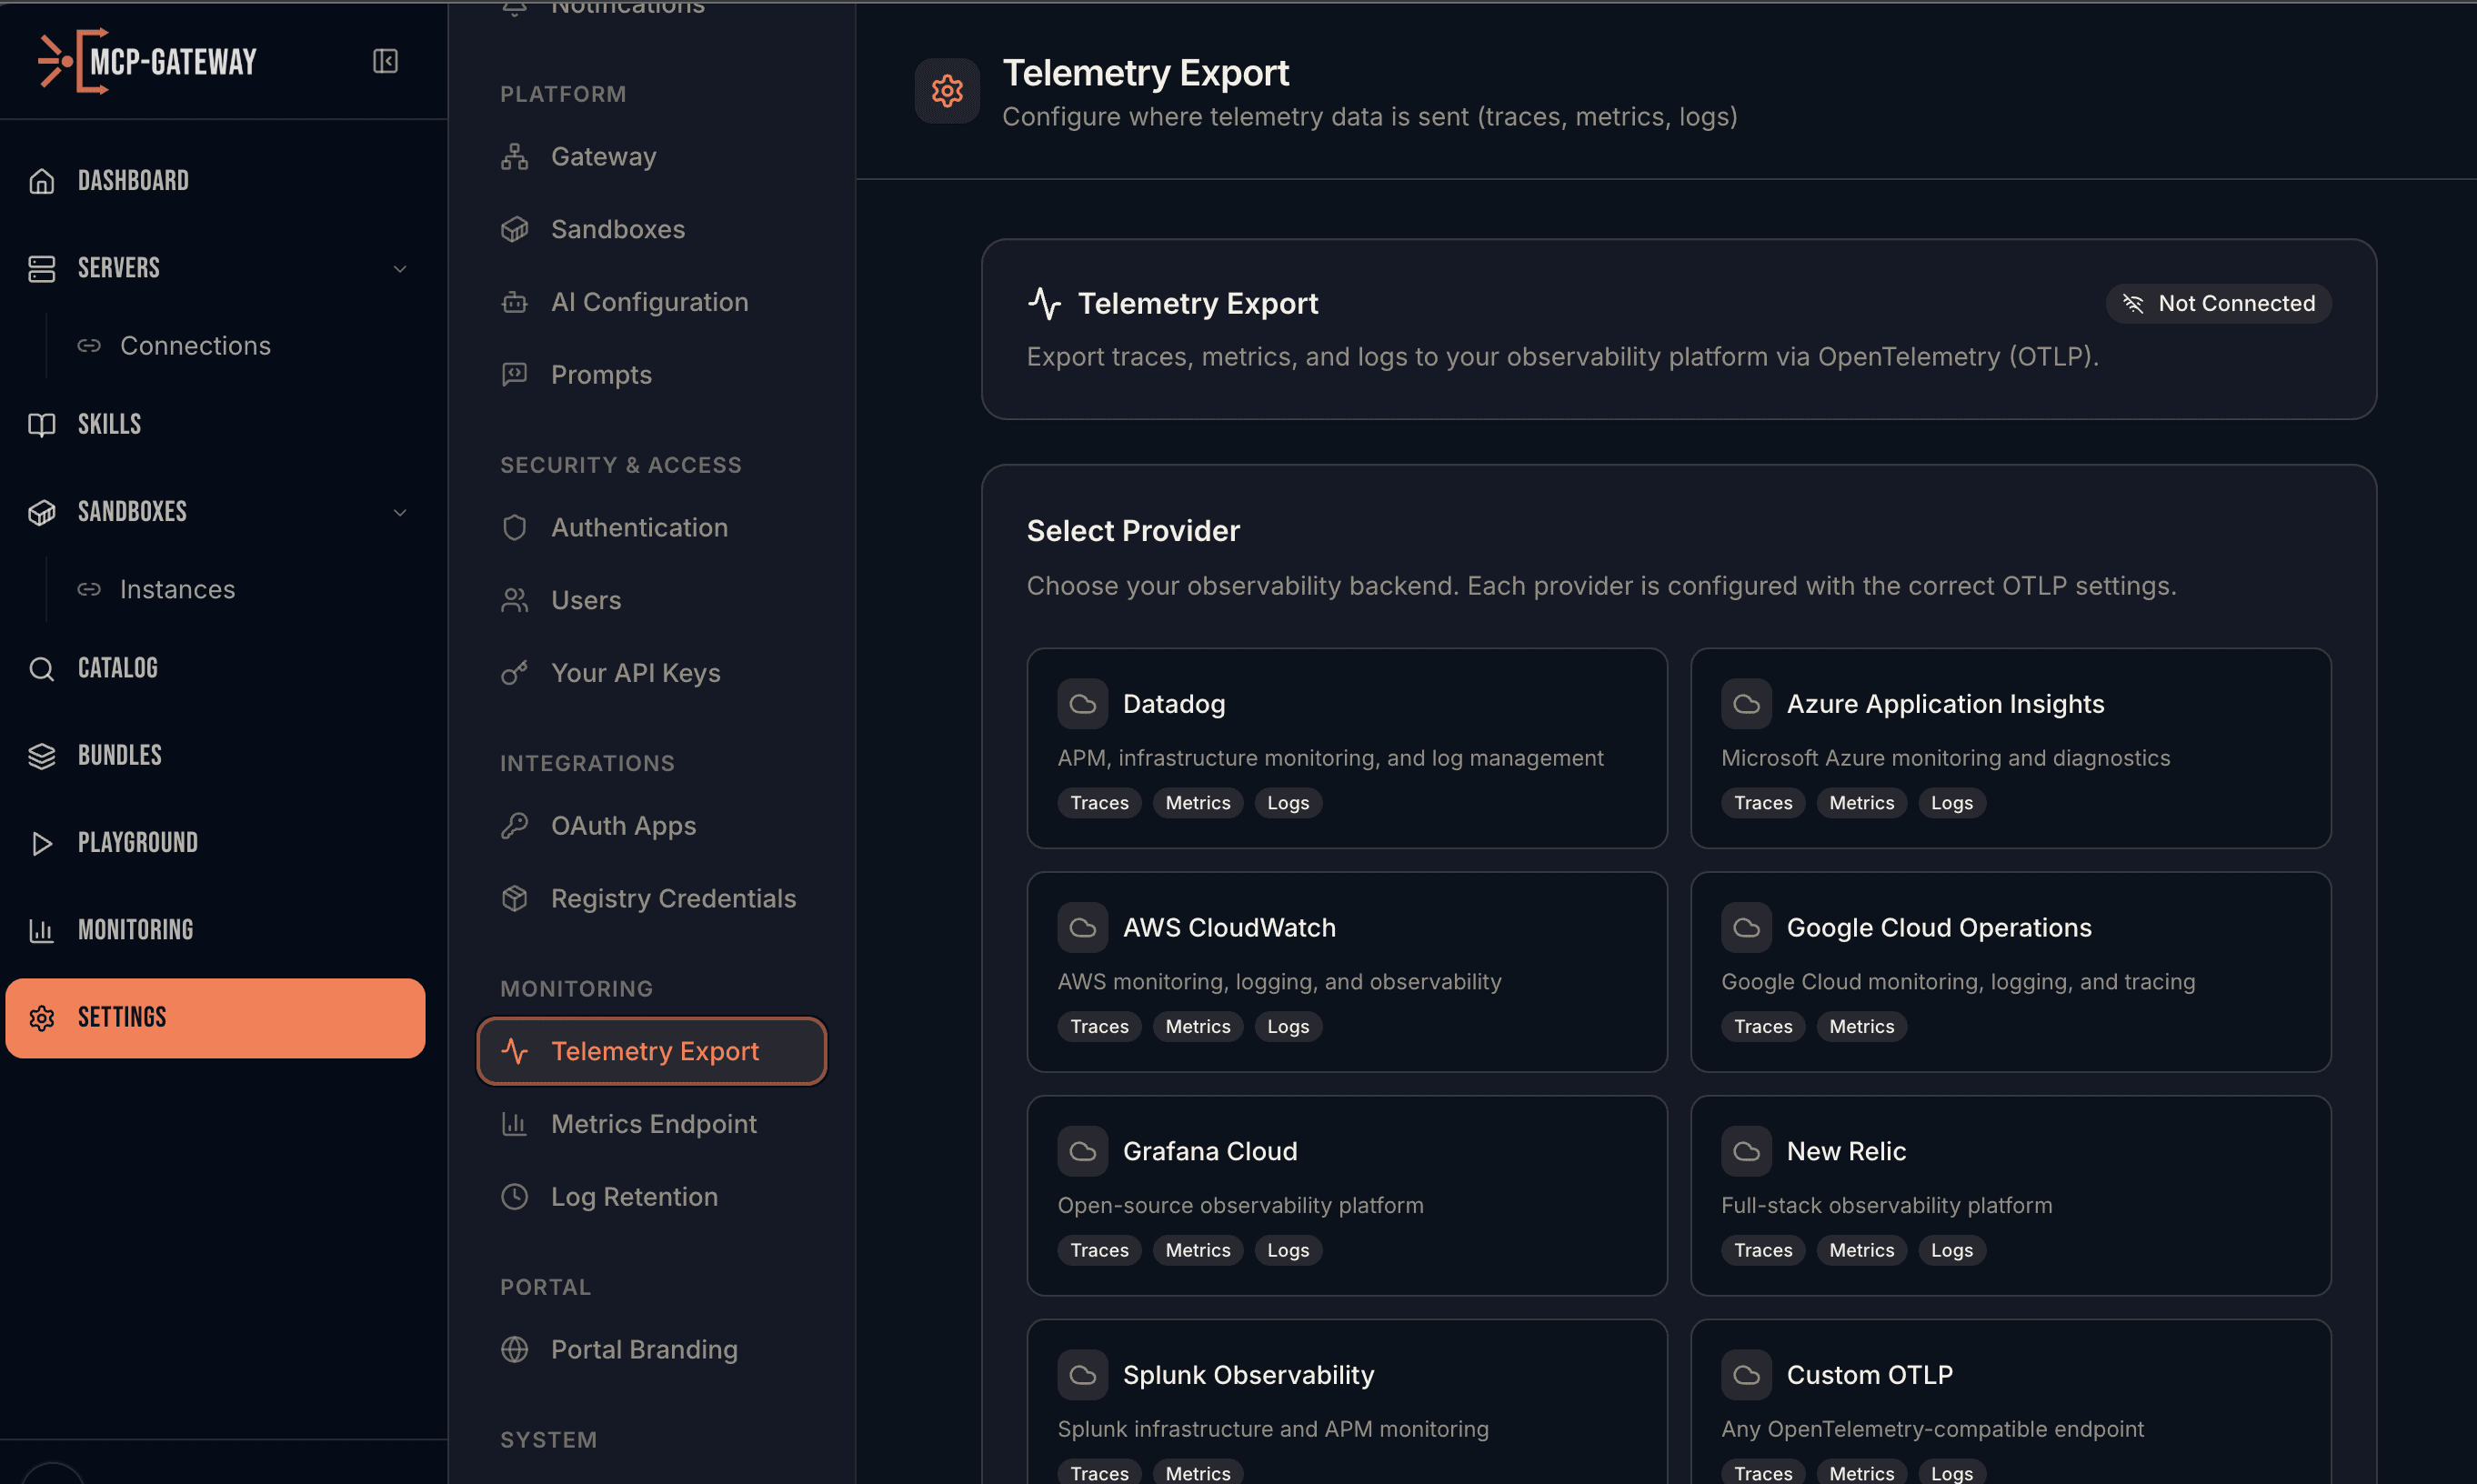
Distributed Tracing
Push traces to any OpenTelemetry-compatible backend — Datadog, Azure Application Insights, AWS CloudWatch, Google Cloud Operations, Grafana Cloud, New Relic, Splunk, or any custom OTLP endpoint. Auto-instruments FastAPI, SQLAlchemy, and HTTPX with zero code changes. Swap providers at runtime without restarting.
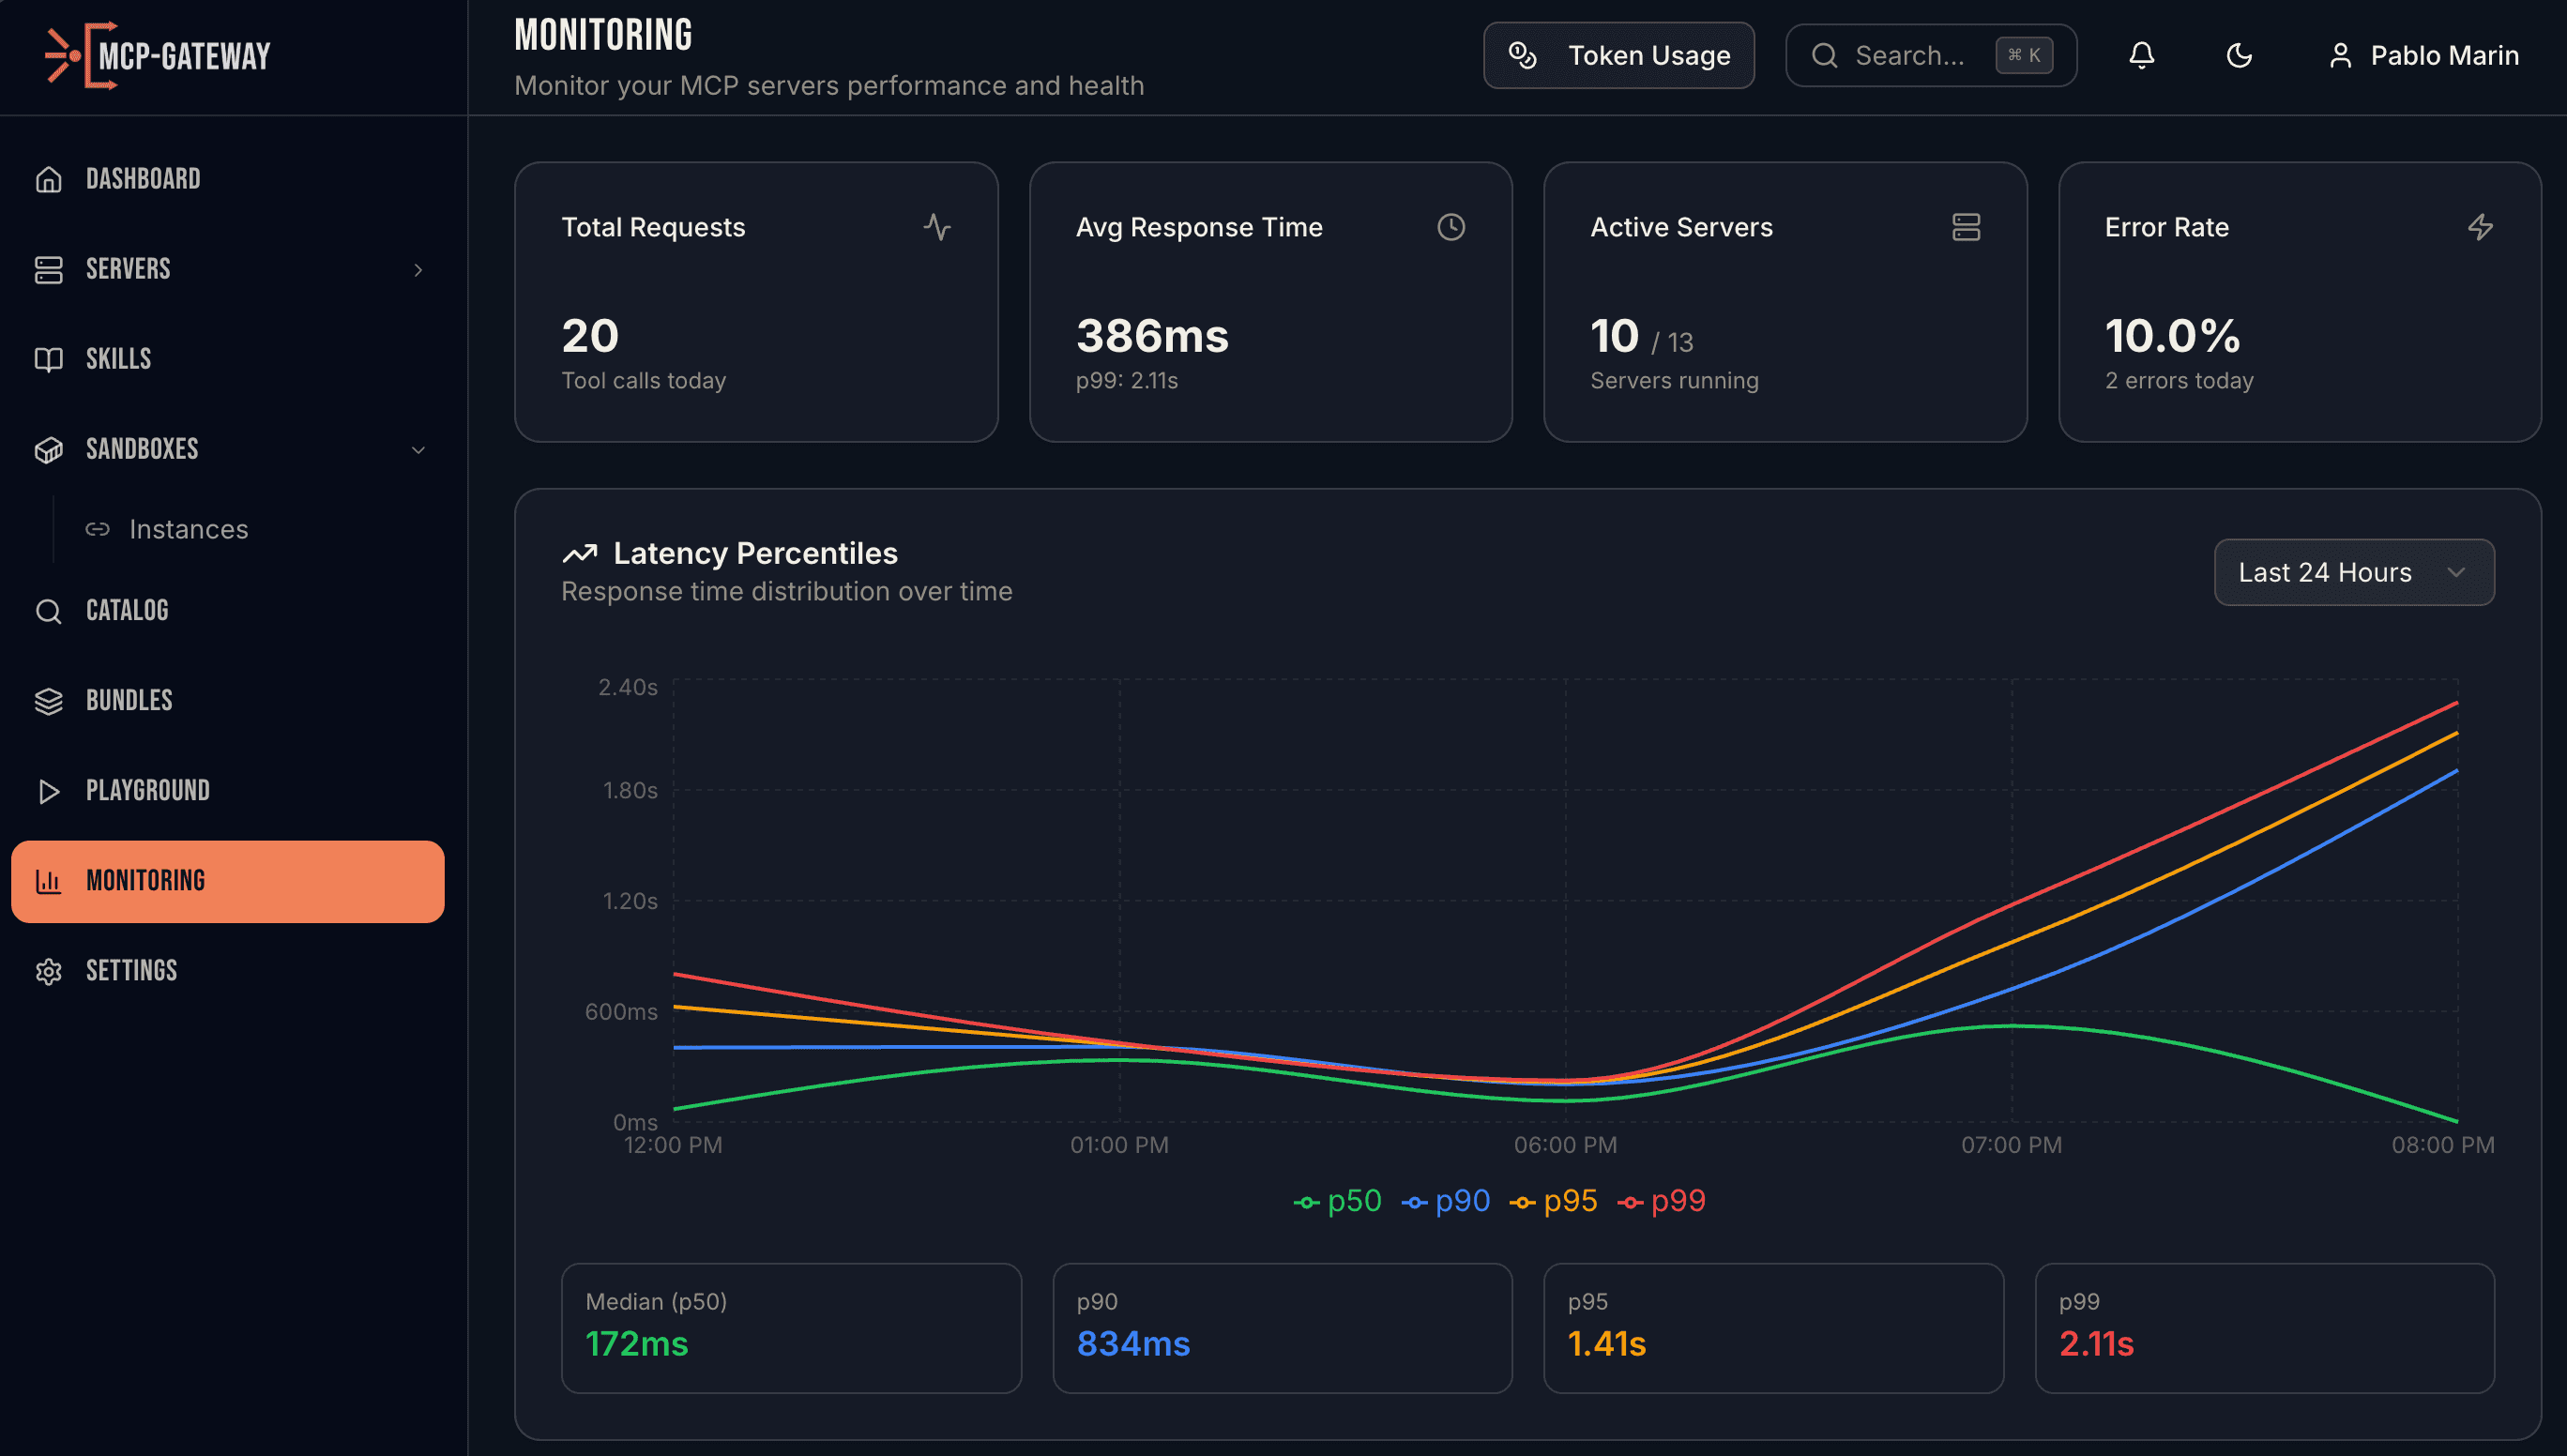
Prometheus Metrics
Pull-based metrics at /api/v1/metrics in Prometheus exposition format. HTTP request counts, latency percentile histograms (p50/p90/p95/p99), tool call success rates, active connections, and token usage — all with automatic UUID normalization to prevent high-cardinality explosion.
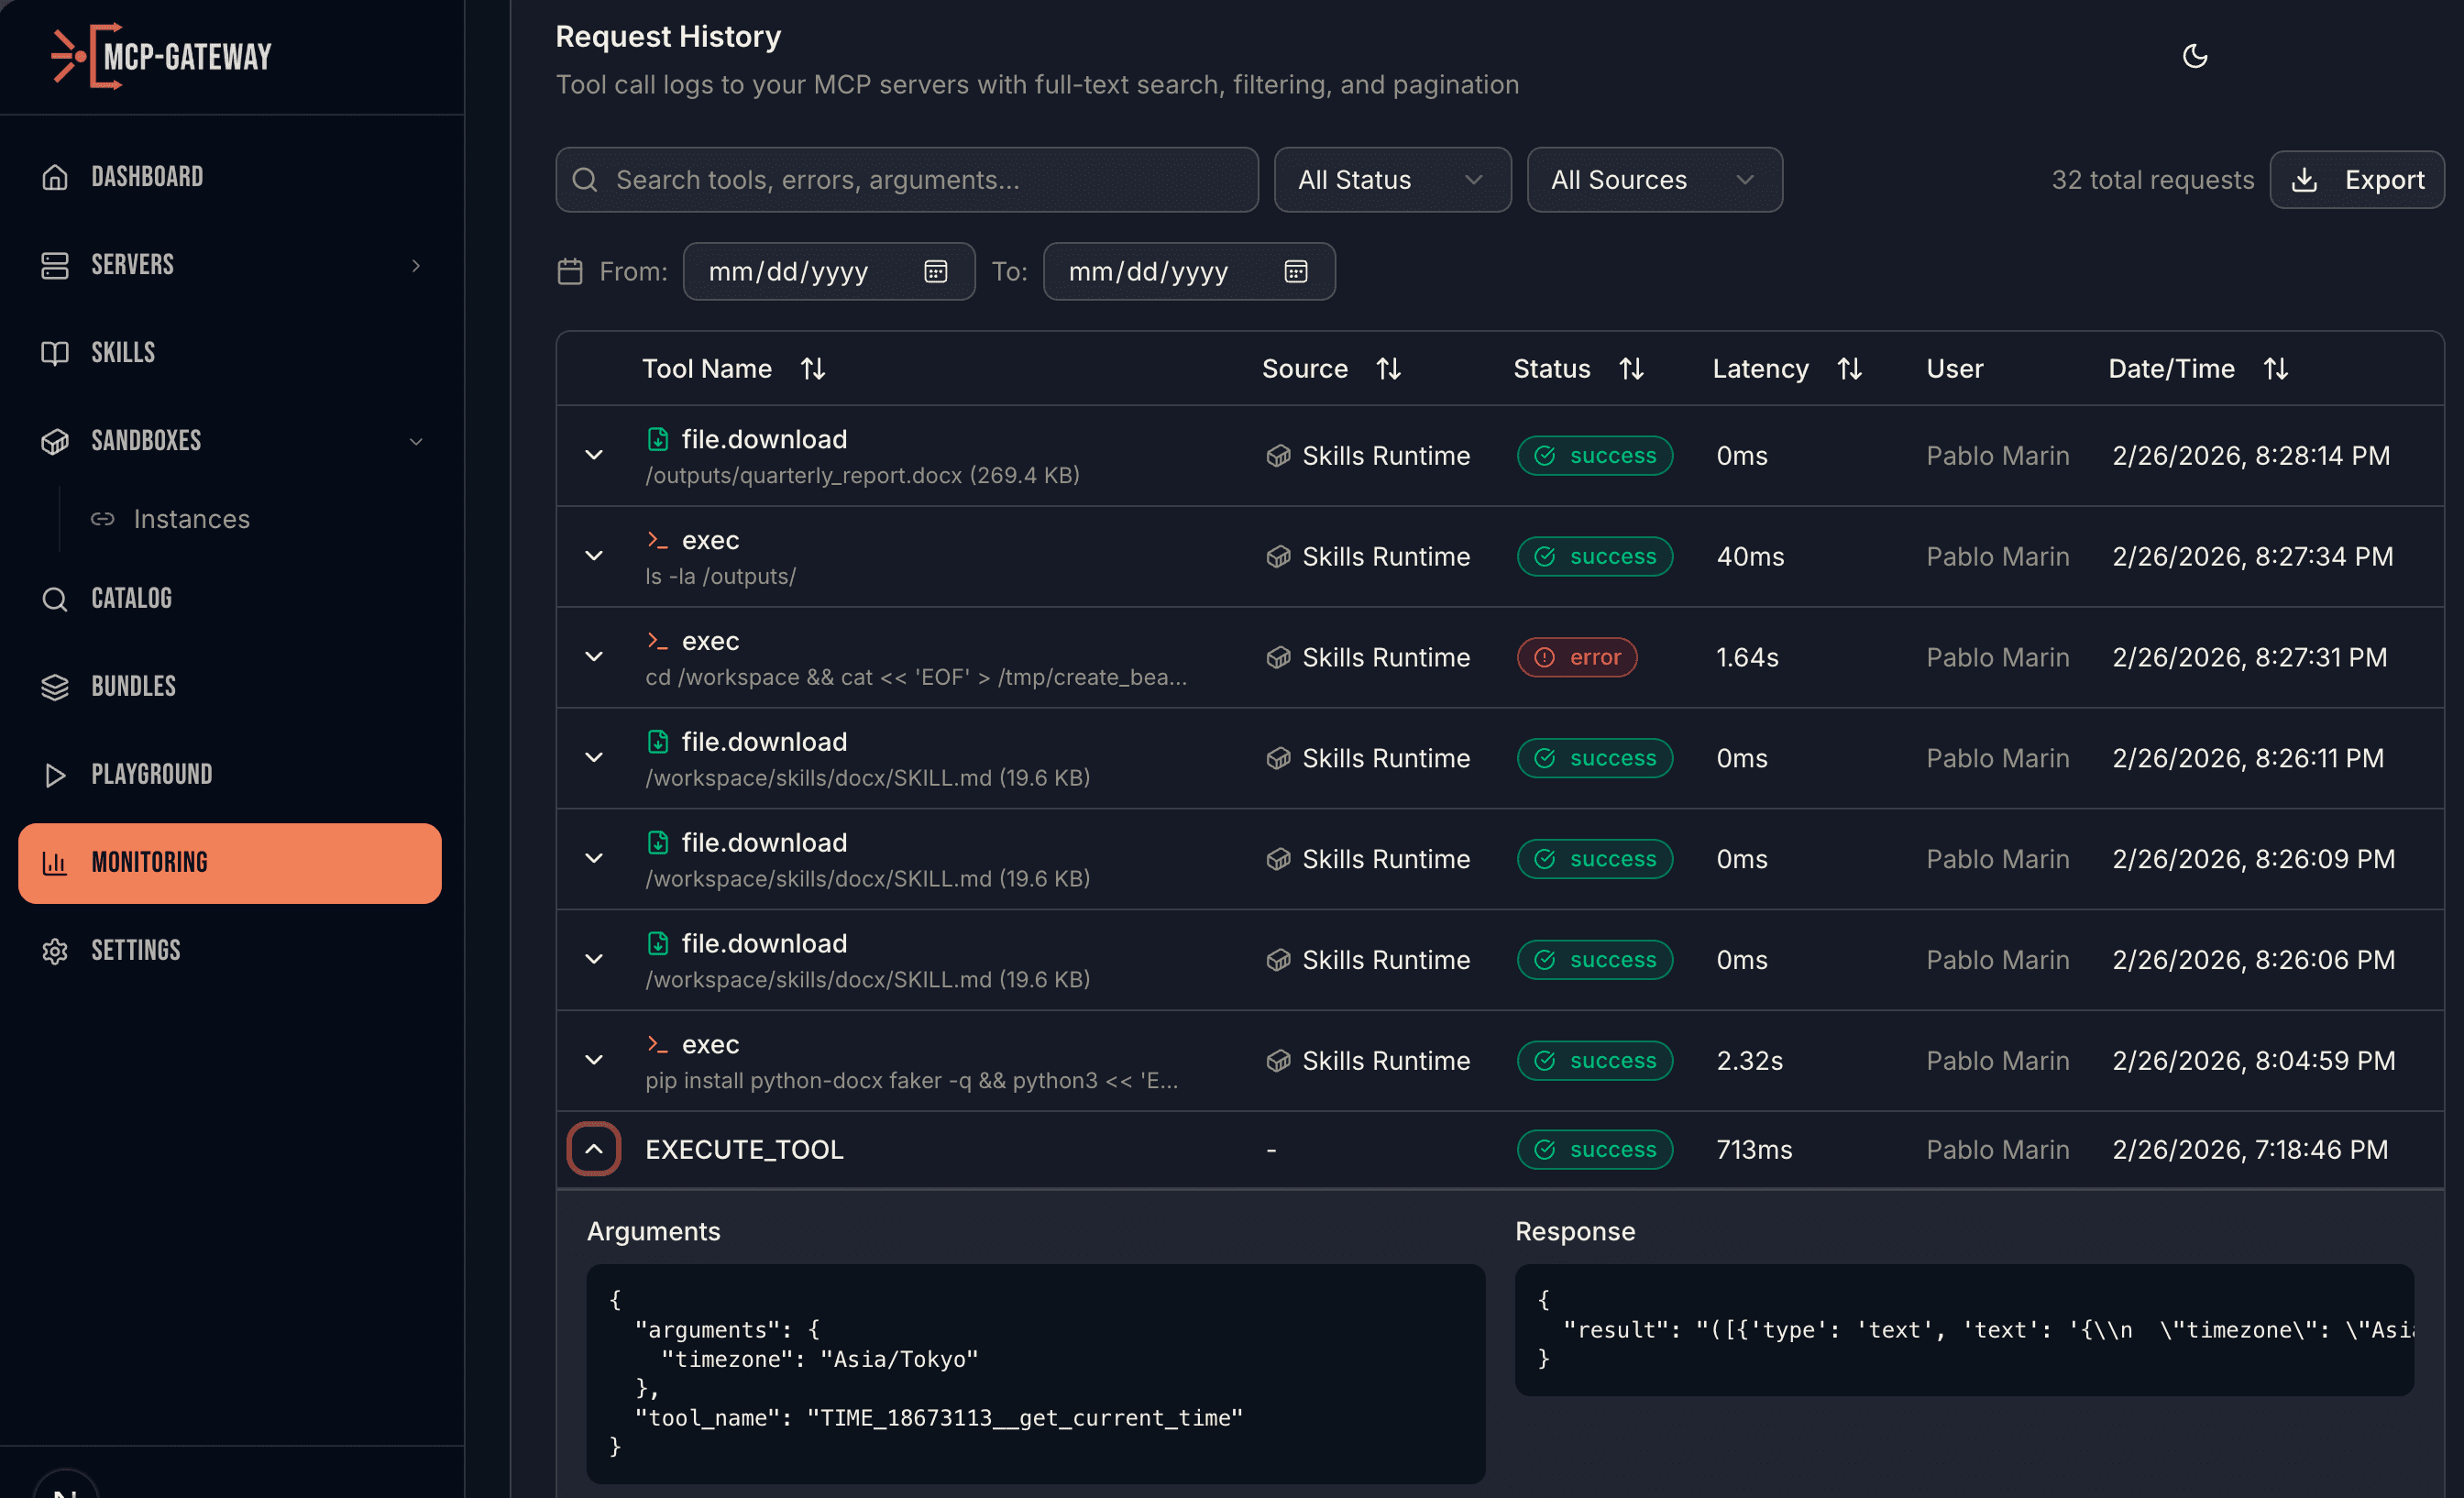
Full Audit Trail
Every MCP tool call, sandbox command, and skill execution is logged to PostgreSQL with full-text search. See the operation type, source, arguments, response, latency, status, and user — with automatic secret masking for API keys, tokens, and passwords. Filter by status, source, date range, and export to CSV.
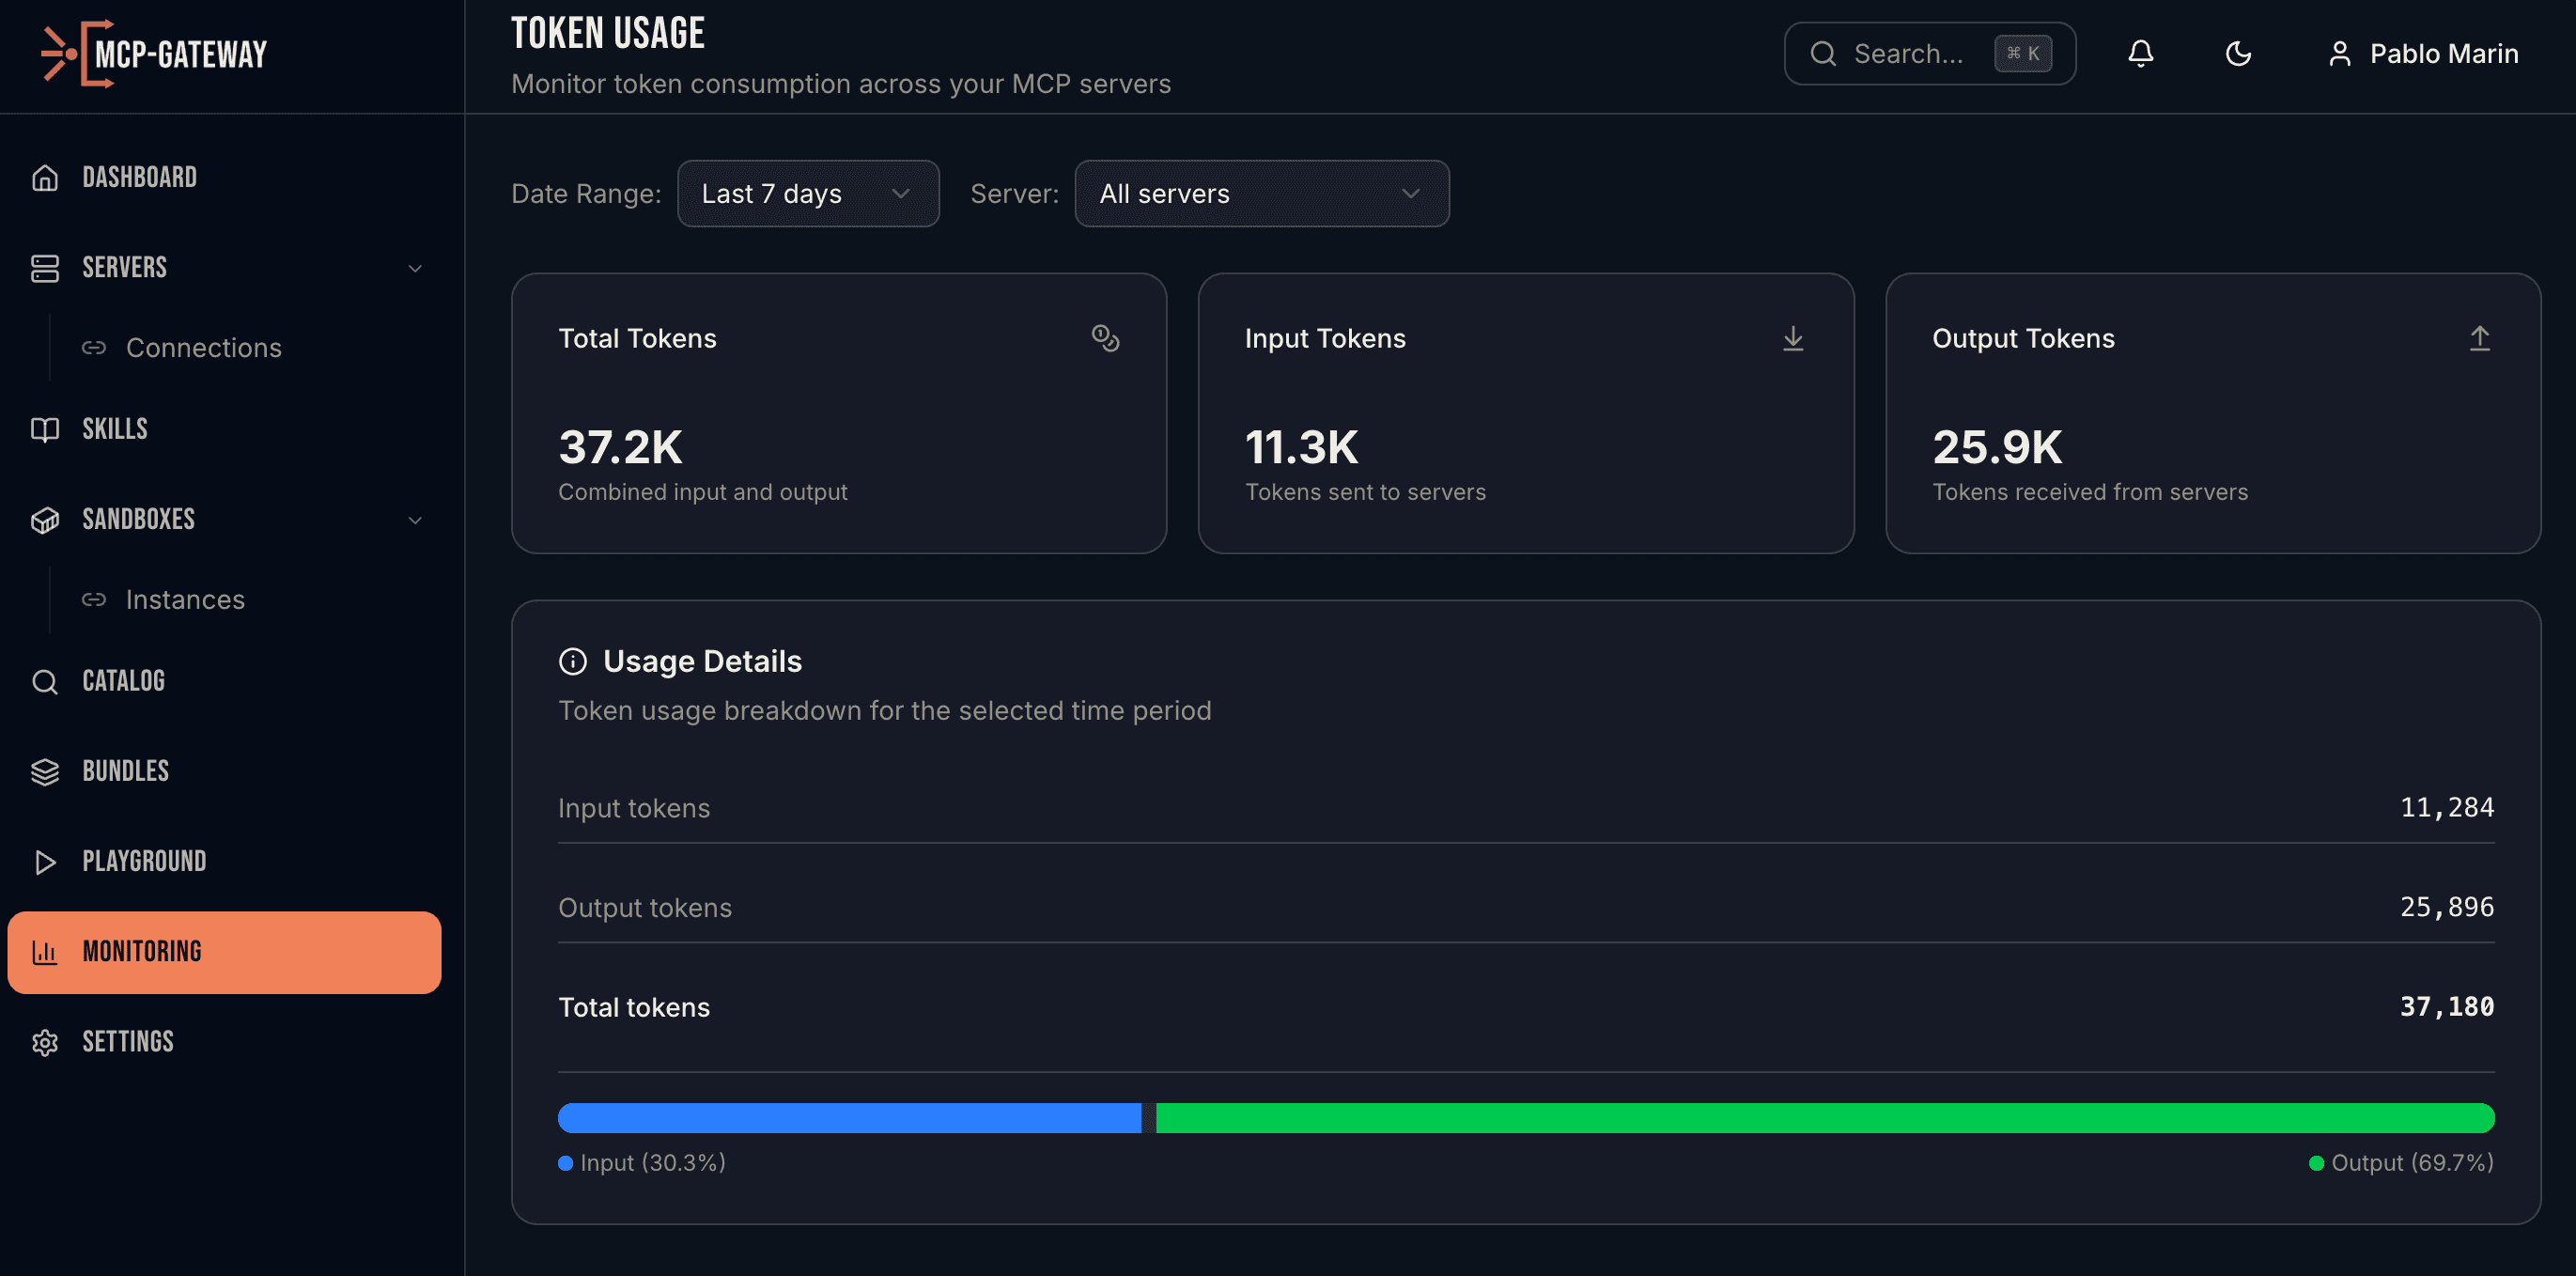
Token Usage Analytics
Track LLM token consumption across every MCP server. Input tokens, output tokens, and total usage with time-range filtering and per-server breakdowns. Know exactly where your AI spend is going and optimize accordingly.
API REFERENCE
Complete Metrics API
Every metric is queryable. Build dashboards, set up alerts, or integrate with your existing monitoring stack.
Ready to see what your agents are doing?
Deploy MCP Gateway and get full visibility into every tool call, sandbox execution, skill invocation, and token.